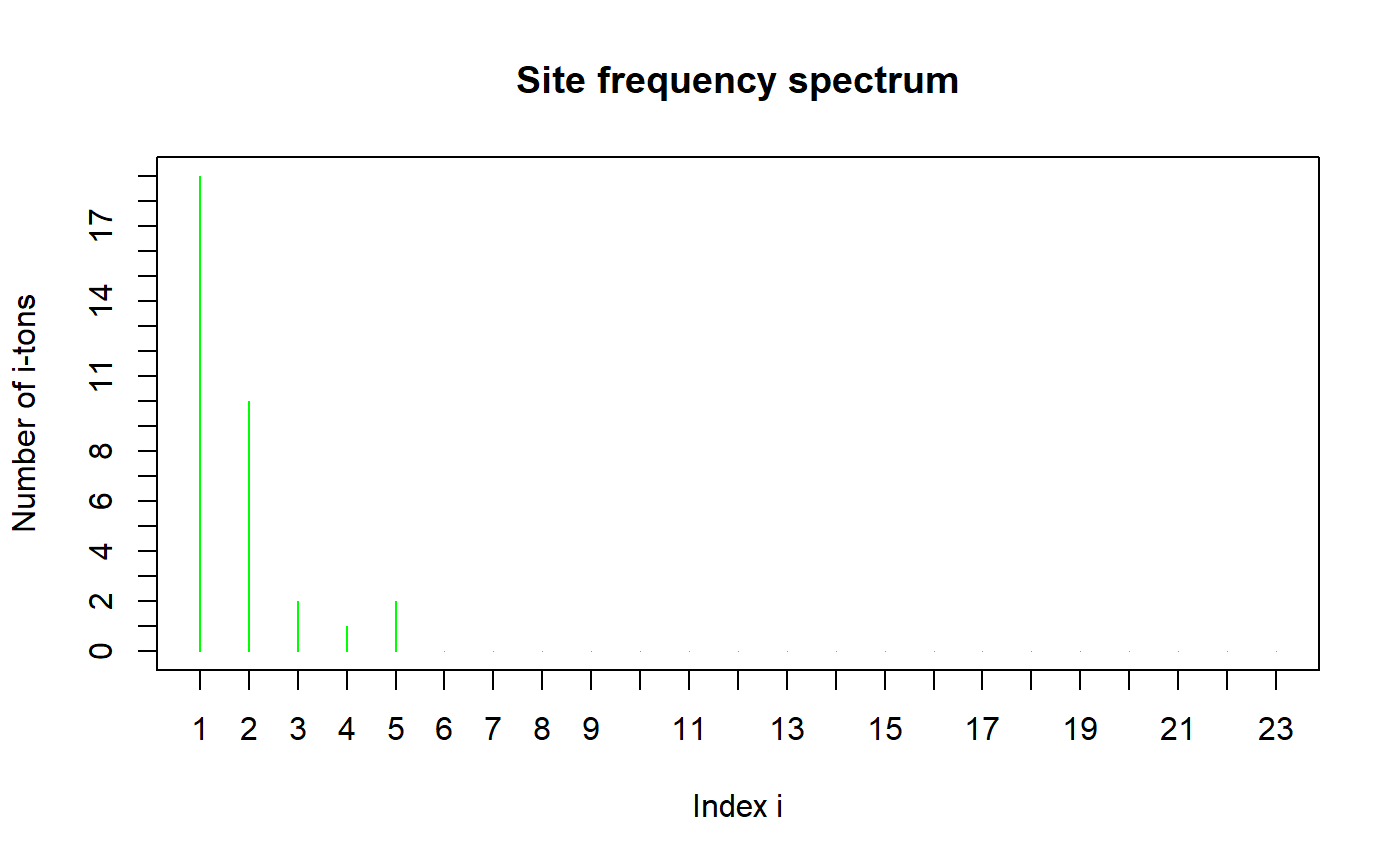
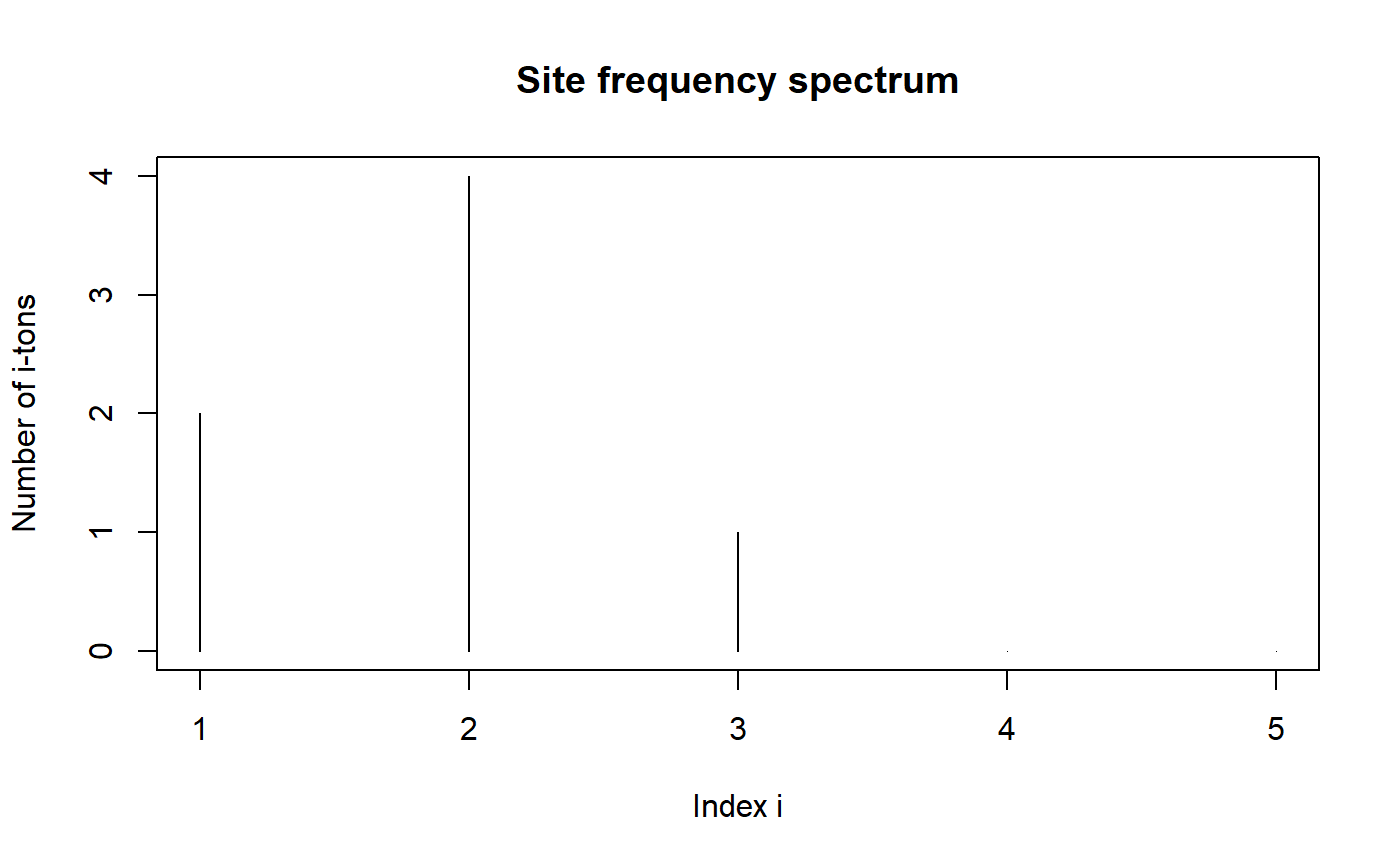
Plots the site frequency spectrum.
# S3 method for SFS_class
plot(SFS, xlab = "Index i",
  ylab = "Number of i-tons", main = "Site frequency spectrum", ...)
Arguments
| SFS | vector with the site frequency spectrum of class 'SFS_class'. |
|---|---|
| xlab | a title for the x axis. Is by default "Index i". See |
| ylab | a title for the y axis. Is by default "Number of i-tons". See |
| main | an overall title for the plot. Is by default "Site frequency spectrum". See |
| ... | arguments passed on from |
Details
The terminology "Number of i-tons" corresponds to the i'th entry in the site
frequency spectrum. See SFS for further explanation.
Examples
# Using the functions simDNAseq and SFS: DNAmat <- simDNAseq(n = 24, seqLen = 58, mutRate = 7, popType = "sudExpPop", expansionTime = 3, proportion = 0.6) plot(SFS(DNAmat), col="green")# Creating the SFS vector by hand: SFSvec <- c(2, 4, 1, 0, 0) class(SFSvec) <- "SFS_class" plot(SFSvec)