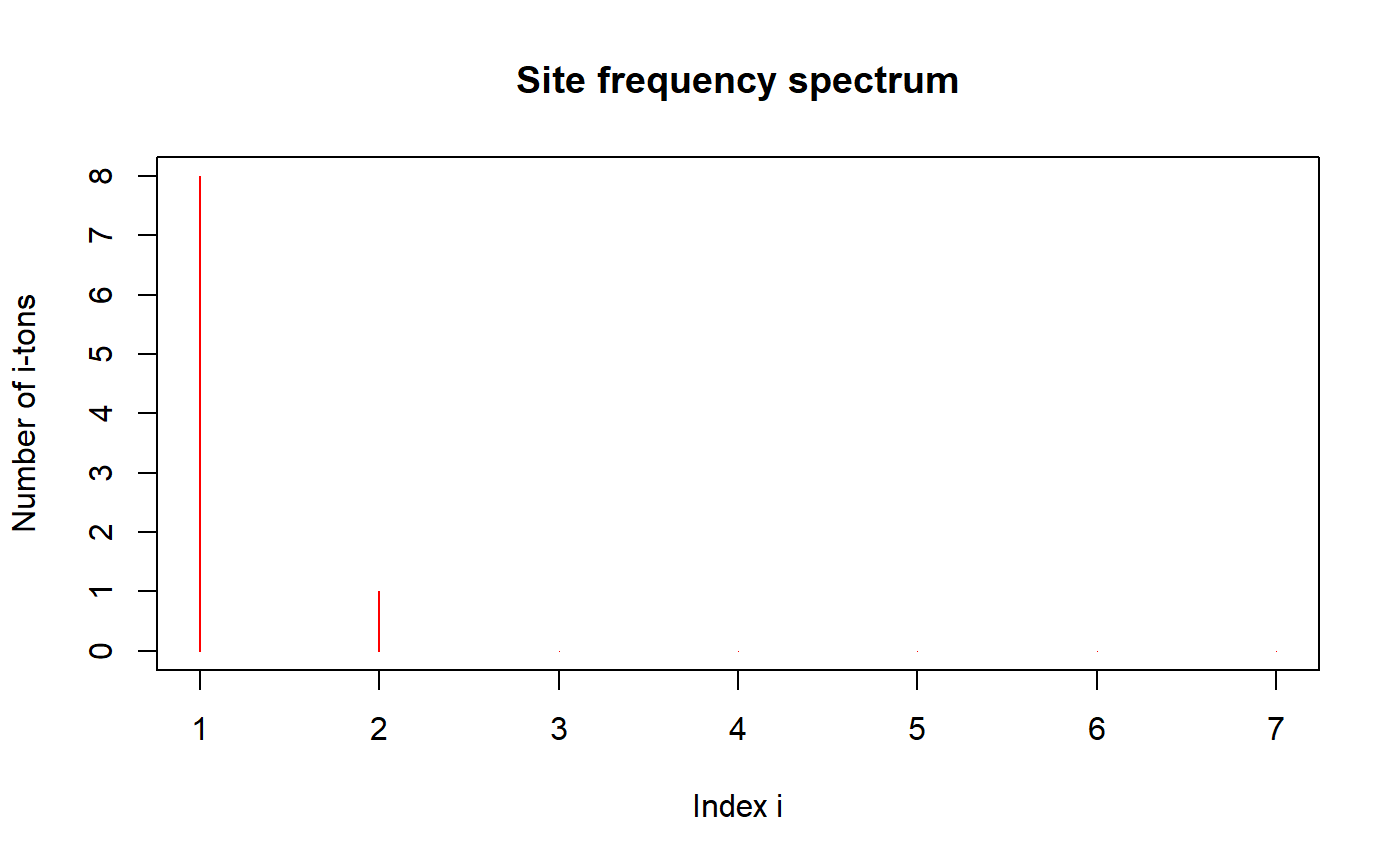
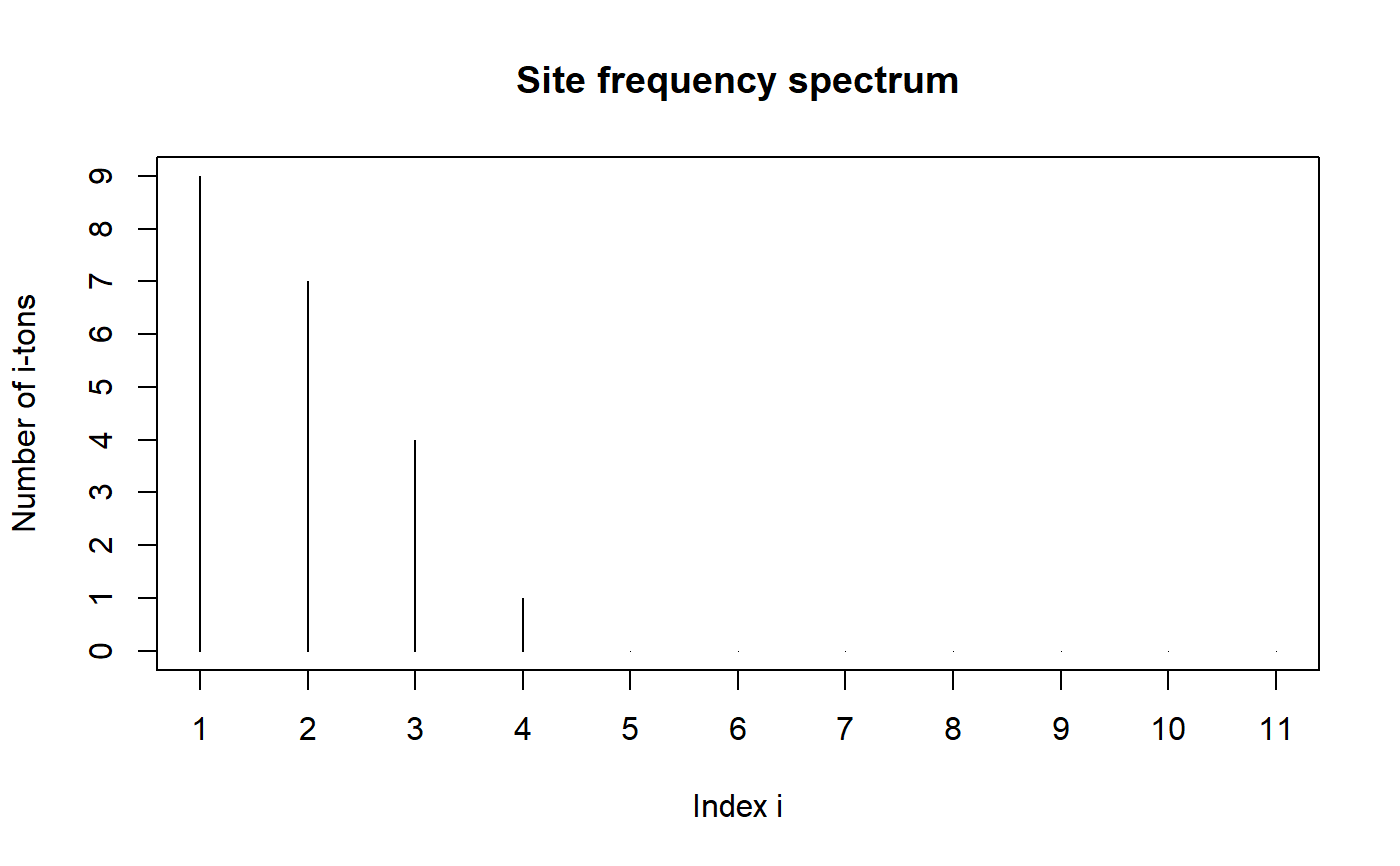
Plots the site frequency spectrum.
# S3 method for DNAmat_class
plot(DNAmat, xlab = "Index i",
  ylab = "Number of i-tons", main = "Site frequency spectrum", ...)
Arguments
| DNAmat | matrix; either a single-nucleotide polymorphism matrix or a segregating
sites matrix of class 'DNAmat_class'. See |
|---|---|
| xlab | a title for the x axis. Is by default "Index i". See |
| ylab | a title for the y axis. Is by default "Number of i-tons". See |
| main | an overall title for the plot. Is by default "Site frequency spectrum". See |
| ... | arguments passed on from |
Details
The terminology "Number of i-tons" corresponds to the i'th entry in the site
frequency spectrum. See SFS for further explanation.
Examples
# Using the function simDNAseq: plot(simDNAseq(n = 8, seqLen = 20, mutRate = 5, popType = "varPop", expRate = 1.5), col="red")# Creating a segregating sites matrix by hand: SegSitesMat <- matrix(sample(x=c(0, 1), size=26*12, replace=TRUE, prob=c(0.9, 0.1)), nrow=12, ncol=26, byrow=TRUE) class(SegSitesMat) <- "DNAmat_class" plot(SegSitesMat)