plot.simulation
plot.simulation.Rdplot.simulation
# S3 method for simulation
plot(x, ggplot = FALSE)
Arguments
| x | A result vector from a simulation algorithm |
|---|---|
| ggplot | A boolean variable, determining if to use ggplot, directly from function call, rather than using control input |
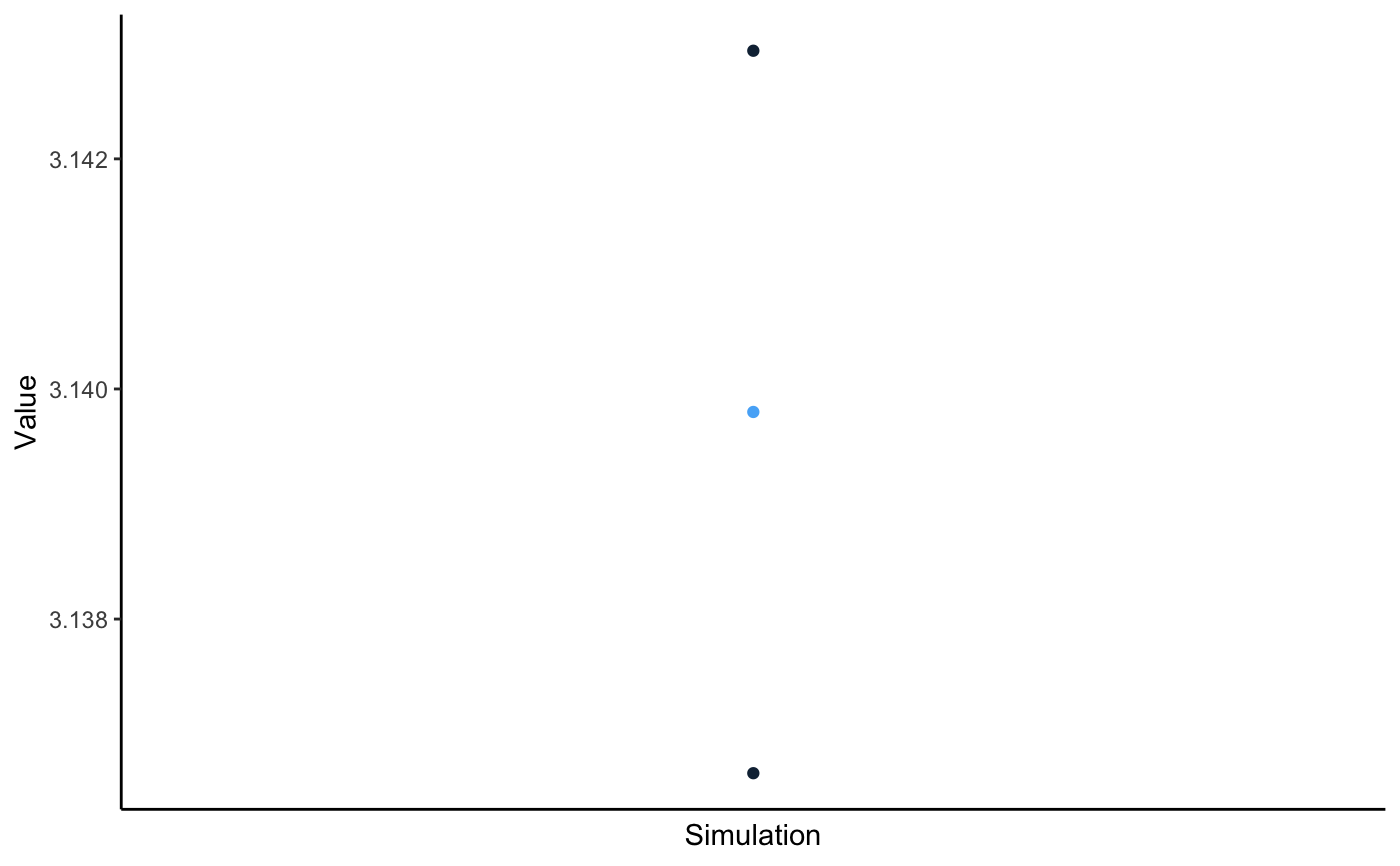
Value
A plot of the summary of the input vector, containing mean, variance, relative error and confidence interval