plot.invsample
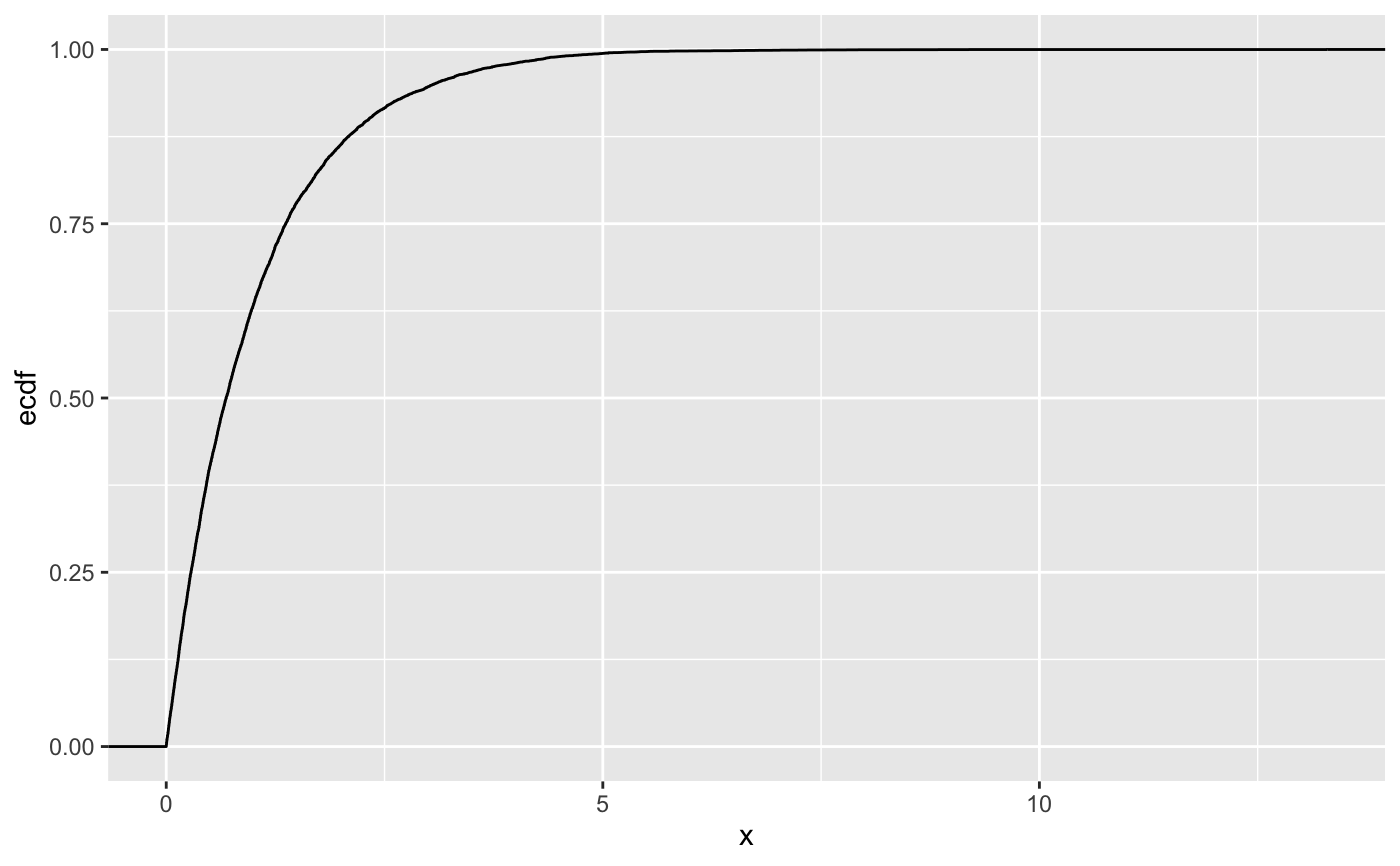
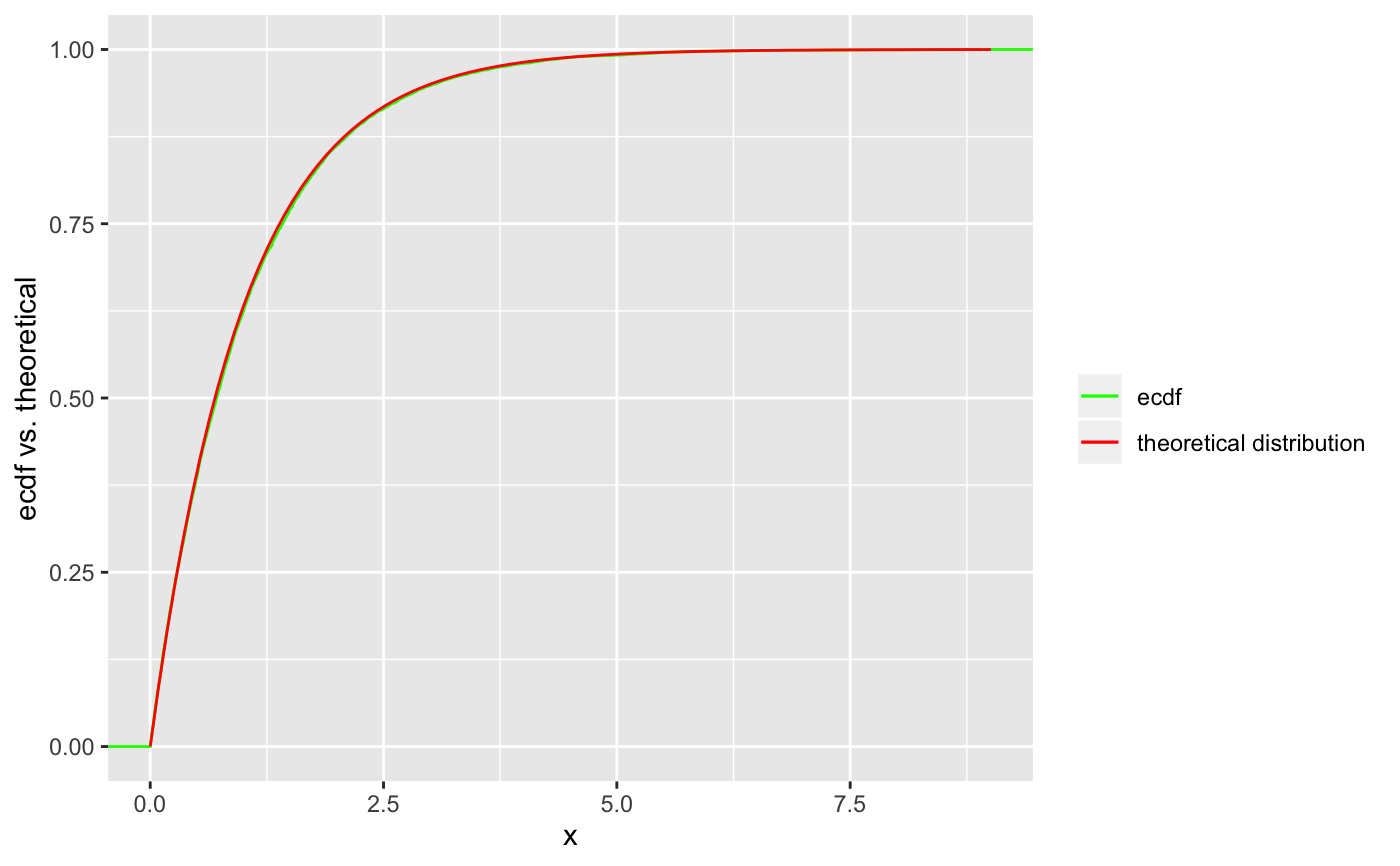
plot.invsample.RdThe function plot.invsample() plots the empirical distribution function of the sampled values
# S3 method for invsample
plot(inv_sample, ggplot = FALSE)
Arguments
| ggplot | indicates if you want to use ggplot; please note that ggplot has to be installed in this case |
|---|
Value
returns a plot of the empirical distribution function
Examples
Finv <- function(x){-log(1-x)} F_dist <- function(x){1-exp(-x)} inv_samples <- inv_sample(Finv, N = 10000) inv_samples_withF <- inv_sample(Finv, N = 10000, F_distribution = F_dist) plot(inv_samples,ggplot = TRUE)