plot.MC_integral
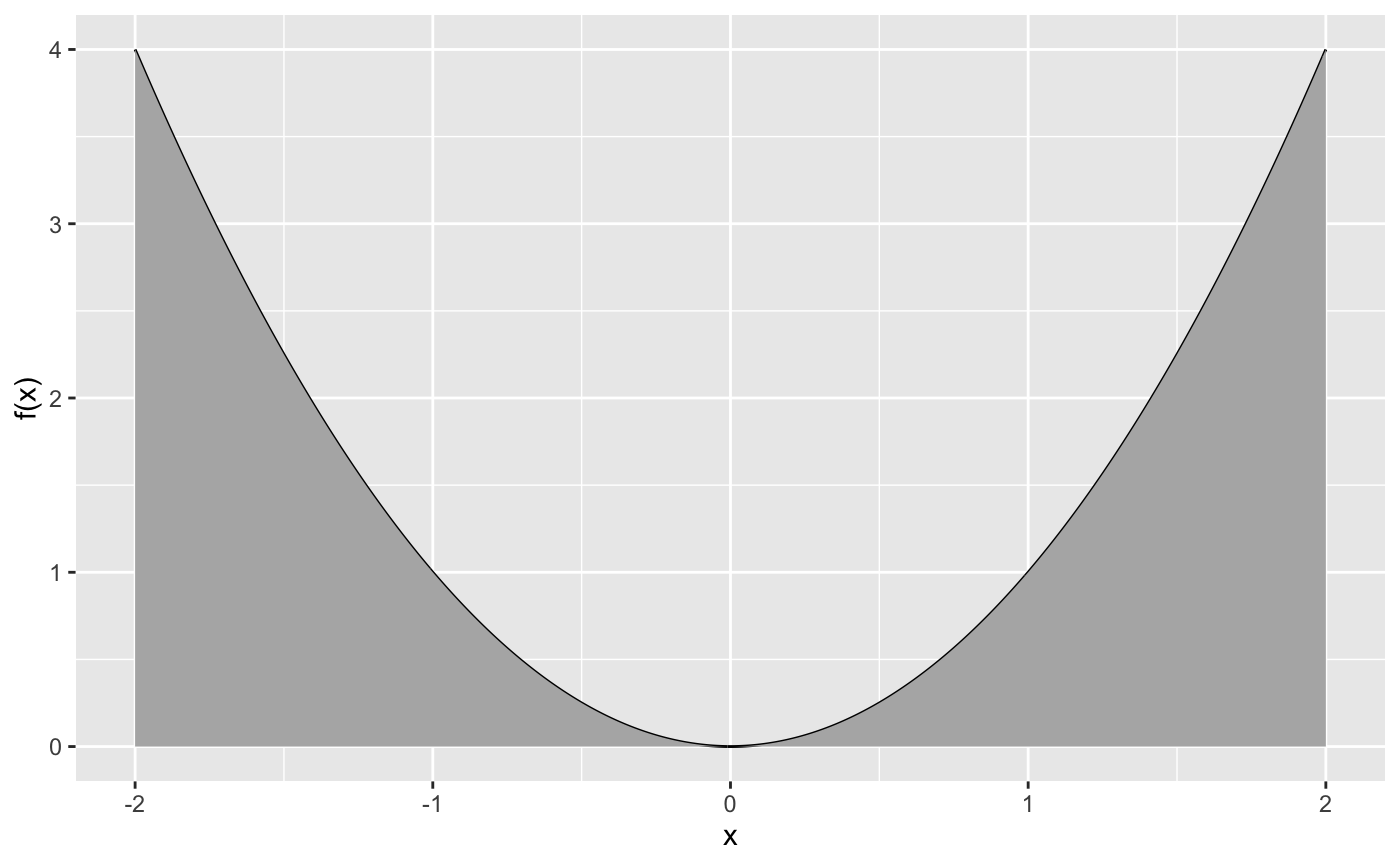
plot.MC_integral.RdThe function plot.MC_integral plots the integrand of a corresponding MC integration
# S3 method for MC_integral
plot(MC, ggplot = FALSE)
Arguments
| MC | output of a Monte Carlo integration |
|---|---|
| ggplot | indicates if you want to use ggplot; please note that ggplot has to be installed in this case |