plot.AR
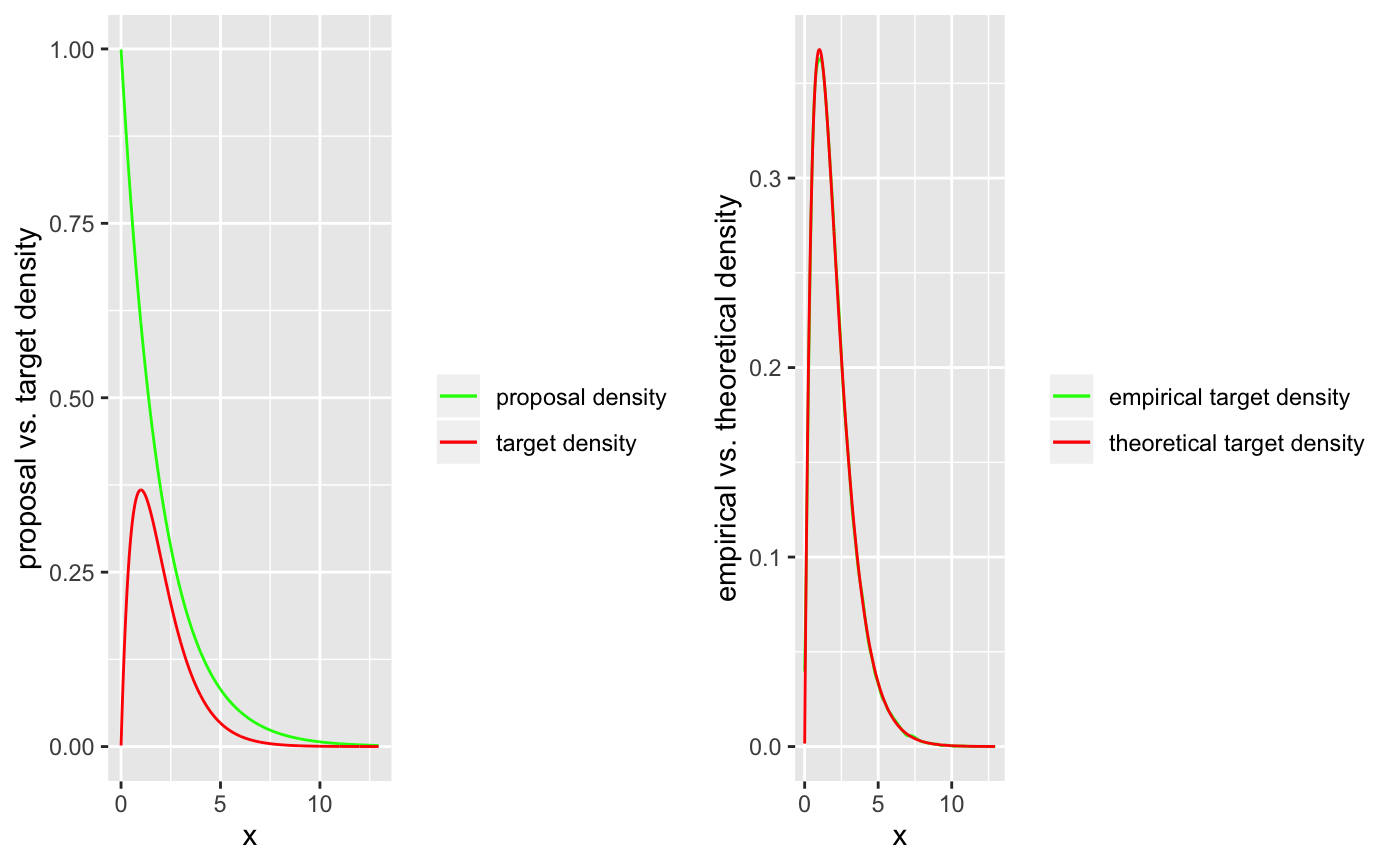
plot.AR.RdThe function plot.ARs() plots the target vs. the proposal density and the empirical vs. the theoretical density of the samples.
# S3 method for AR
plot(ARsample, ggplot = FALSE)
Arguments
| ARsample | samples created by acceptance rejection |
|---|---|
| ggplot | indicates if you want to use ggplot; please note that ggplot has to be installed in this case |
Examples
C <- 1.6
lambda <- 0.5
f <- function(x) {x*exp(-x)}

ARsimulation <- ARsim(f, C, 100000, rate = lambda)
plot(ARsimulation, ggplot = TRUE)